
Des Moines Area Housing Statistics
The Des Moines metro housing market continued to show year-over-year growth in September, with rising inventory, increased closed sales and higher home values giving buyers and sellers opportunities as the market transitions into fall, according to the latest housing statistics from the Des Moines Area Association of REALTORS®.
“September’s numbers reflect a market that continues to offer opportunities even as buyer activity shifts with the season,” said Scott Steelman, DMAAR president. “Inventory is up more than 13% from a year ago, closed sales have increased, and home prices continue to grow. While pending sales have slowed, buyers have more homes to consider, and the market remains active heading into the final months of the year.”
Active listings turned typical fall cooldown trends on its head in the Des Moines metro through September. With 5,028 active listings, the metric saw a 14.2% increase over the 4,403 active listings of one year ago, and a 6.9% increase over the 4,7029 active listings of August.
Closed sales came to 1,207 in September, a 4.8% increase from last year’s 1,152 closed sales. Conversely, month-over-month sales decreased 4.4% from the 1,143 closed transactions of August. Year-to-date, closed sales remain a bright spot with 11,111 total units sold through the Des Moines metro area.
Pending sales previewed the typical fall slowdown: the 939 pending transactions of September represent a 16.5% decrease from the 1,124 pending transactions of September 2025, while the figure is a 17.8% decrease from August’s 1,143 pending sales.
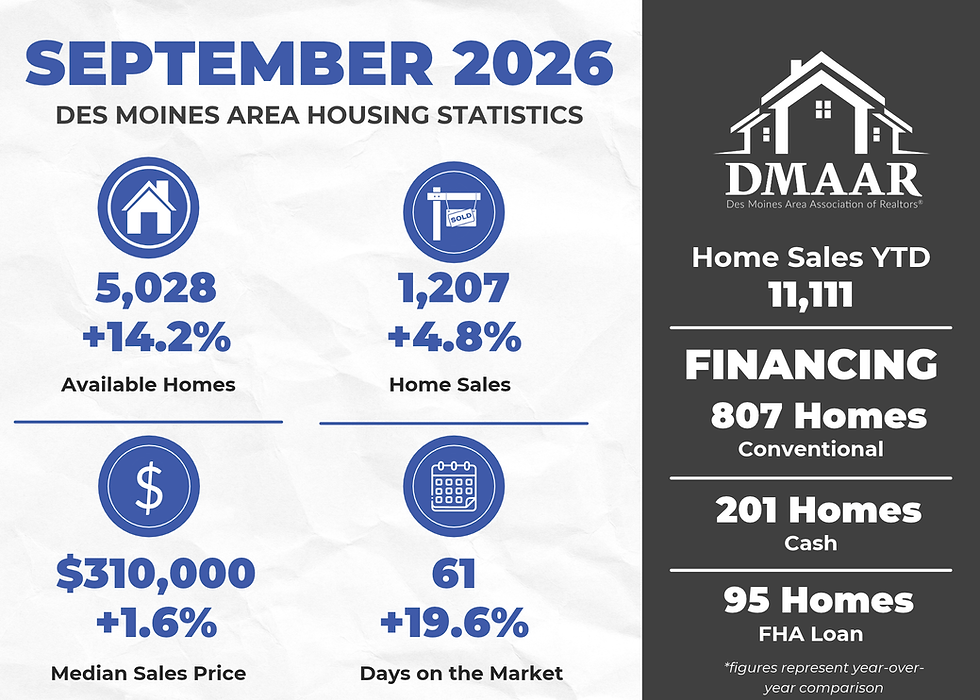
Median sales price came to $310,000, a 1.6% increase from the $305,000 median sales price of September 2025, while monthly median sales price comparisons dipped 3% from the $319,725,000 median sales price of August.
The 61 median days on market were a 19.4% increase from the 51 median days recorded in September 2025, and a 22% increase from the 50 days recorded last month.
Conventional financing accounted for 807 transactions, or 74% of all sales in August. Homebuyers paid cash for 201 transactions, or 18% of sales, while FHA loans were used in 95 transactions, or 8% of sales.


Comments